利用模拟NGS数据研究kmers的分布
wgsim, a tool for simulating NGS reads from reference sequences.
Usage:   wgsim [options] <in.ref.fa> <out.read1.fq> <out.read2.fq>

Options: -e FLOAT      base error rate [0.020]
         -d INT        outer distance between the two ends [500]
         -s INT        standard deviation [50]
         -N INT        number of read pairs [1000000]
         -1 INT        length of the first read [70]
         -2 INT        length of the second read [70]
         -r FLOAT      rate of mutations [0.0010]
         -R FLOAT      fraction of indels [0.15]
         -X FLOAT      probability an indel is extended [0.30]
         -S INT        seed for random generator [0, use the current time]
         -A FLOAT      discard if the fraction of ambiguous bases higher than FLOAT [0.05]
         -h            haplotype mode
以绵羊(Ovis aries)的24号染色体序列为例,模拟20×的 Illumina PE reads, read length=100,假设没有base error。 number_of_reads(N)= 20× length_of_ref/(read_length × 2) =4.2e6
wgsim -e 0 -1 100 -2 100 -S 44 -N 4200000 oar_chr24.fa test_F.fq test_R.fq
使用dsk计算K-mers的coverage distribution,取K-mer size=31,
# k-mers distribution of reference chromosome, oar_chr24
dsk -file oar_chr24.fa -kmer-size 31 -histo-max 200 -out oar_chr24
# output file: oar_chr24.h5

h5dump -y -d histogram/histogram oar_chr24.h5 | grep "^\ *[0-9]" |tr -d ", " | paste - - >oar_chr24_kmerSize31_coverage.txt

# k-mers distribution of simulated reads
dsk -file test_F.fq,test_R.fq -kmer-size 42 -histo-max 200 -out test
# output file: test.h5

h5dump -y -d histogram/histogram test.h5 | grep "^\ *[0-9]" |tr -d ", " | paste - - >test_kmerSize31_coverage.txt
接下来分别看kmer size=31时,chr24参考序列和模拟的reads的31-mers coverage distribution
1) chr24参考序列的31-mers分布情况
| coverage | counts |
|---|---|
| 1 | 38458117 |
| 2 | 441456 |
| 3 | 85126 |
| 4 | 37148 |
| 5 | 21574 |
| 6 | 13682 |
| 7 | 9055 |
| 8 | 6752 |
| 9 | 5197 |
| 10 | 3896 |
也就是说38458117个31-mers仅出现一次,441456个31-mers出现两次,85126个31-mers出现三次,多次出现的kmer可能是由于基因组上的重复序列。
2) simulation NGS reads (20×)的31-mers分布情况
kmers coverage distribution如下图所示:
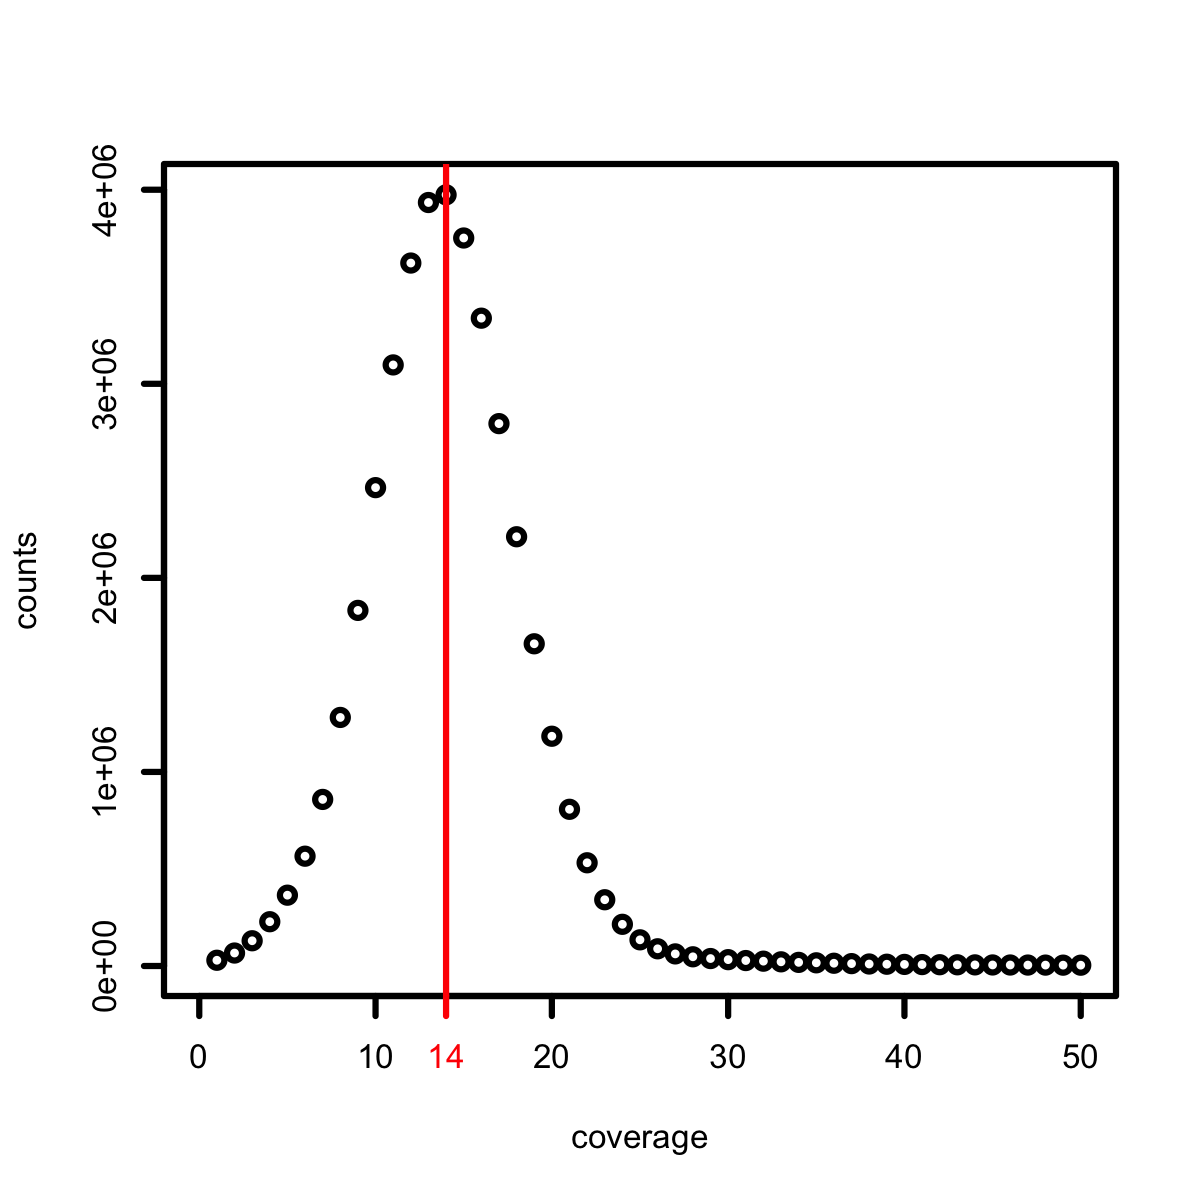
模拟的NGS数据的31-kmer的分布,peak出现在coverage=14的位置。因为模拟的reads长度为100nt,则每一条read最多可能有100-31+1=70个不同的31-kmers,模拟的是20×的NGS数据量,绝大多数的31-kmers在参考序列中是unique的,所以 simulation NGS reads的31-mers distribution的peak出现就在X轴(coverage)14(70×20/100=14)的位置。
如果模拟的NGS reads不是 error free,31-mers分布可能会出现偏移。